


Duck Curve: How Energy Storage Rewrites Solar’s Grid Rulebook
What Is the Duck Curve, and Why Does It Matter for Energy Storage?
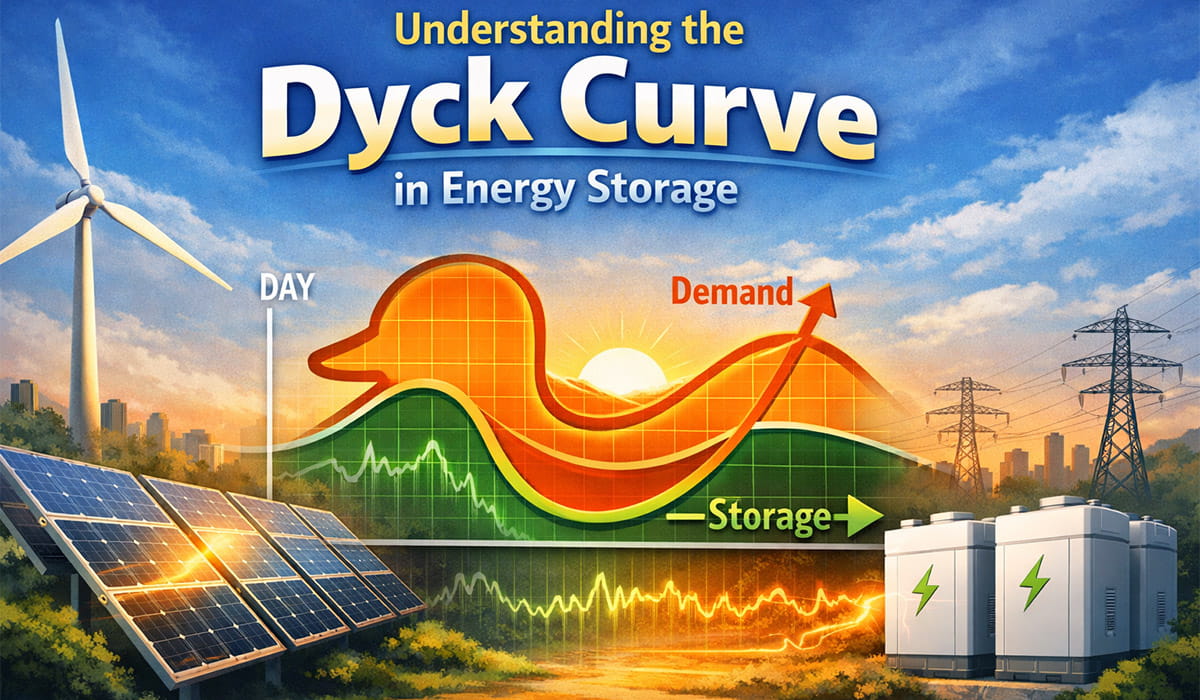
If you’ve worked in renewable energy or grid management, you’ve probably heard the term “duck curve”—but what is the duck curve, really? Put simply, the duck curve (also called the duck graph or energy duck curve) is a visual representation of net electricity load over a 24-hour period, showing the stark imbalance between solar energy production and consumer demand in regions with high solar penetration. It’s not just an energy curve; it’s a critical warning sign for grid stability, and energy storage—especially batteries—is our most powerful tool to fix it. The curve gets its name from its shape: a deep midday “belly” (when solar production peaks and demand is low) and a steep evening “neck” (when solar fades and demand spikes), resembling a duck in profile. Without solutions like battery storage, this imbalance threatens to derail our transition to clean energy.
The Solar Duck Curve: How Solar Power Shapes the Duck’s Silhouette
The duck curve solar connection is undeniable—this phenomenon wouldn’t exist without the rapid growth of solar energy. As more utility-scale and rooftop solar systems come online, the solar duck curve becomes more pronounced: midday, when the sun is strongest, solar production surges, slashing the need for electricity from traditional power plants and creating that deep midday belly. This is what we call the duck curve solar effect, and it’s most visible in regions leading the renewable transition, like California. The duck curve energy dynamic here is clear: solar generates too much power when we need it least, and too little when we need it most (evenings, when people return home and turn on lights, appliances, and EVs). Over time, as solar capacity grows, the duck’s belly sinks lower, and its neck grows steeper—amplifying grid challenges.
California Duck Curve: The Ground Zero of Duck Curve Challenges
When people talk about the duck curve, they’re often referring to the California duck curve—the first and most famous example of this phenomenon. The California ISO (Independent System Operator) was the first to document the duck curve in its reports, highlighting how solar growth was reshaping the state’s grid. Updated regularly, these reports detail the state’s unique struggles: as solar penetration increased, the midday net load (demand minus solar production) dropped dramatically, forcing grid operators to curtail excess solar power to avoid oversupply. Worse, the steep evening ramp (the duck’s neck) required conventional power plants to ramp up production quickly—straining equipment and increasing reliance on fossil fuels. The California duck curve isn’t just a local issue; it’s a blueprint for how the world will grapple with solar integration as renewables scale globally.
Frequency Response Duck Curve: Why Grid Stability Is at Stake
One of the most critical (and often overlooked) aspects of the duck curve is its impact on grid stability: the frequency response duck curve connection. Grid frequency (around 60 Hz in the U.S.) must stay within a tight range to avoid blackouts, with conventional power plants providing automatic frequency response to balance supply and demand. But the duck curve disrupts this: midday, when solar is high, conventional plants are shut down or run at low levels, reducing available frequency response capacity. When the evening ramp hits, the sudden surge in demand can cause frequency fluctuations, threatening grid reliability. This is where the ability to balance supply and demand during duck curve peaks and valleys becomes essential—and where energy storage steps in to fill the gap.
Duck Curve Before and After Battery: How Storage Transforms the Duck
The biggest game-changer for the duck curve is battery energy storage—and the difference between the duck curve before and after battery integration is nothing short of transformative. Before batteries, grid operators had few tools to address the duck curve: they could curtail solar, rely on fossil fuel peaker plants, or hope for reduced evening demand—but none of these solutions were clean or efficient. After battery integration, everything changes. Batteries charge during the midday belly (when solar is abundant and electricity is cheap), storing excess solar power that would otherwise be wasted. Then, during the evening neck (when demand spikes and solar fades), batteries discharge that stored energy, smoothing the steep ramp and reducing the need for conventional power plants. The duck curve before and after battery deployment is night and day: the belly becomes shallower (less excess solar), the neck becomes gentler (no sudden demand surges), and the grid becomes more stable, clean, and efficient. This transformation isn’t theoretical—it’s already happening in California, where battery storage is helping tame the state’s duck curve and reduce fossil fuel use.
The Future of the Duck Curve: Energy Storage as the Ultimate Solution
As renewable energy grows globally, the duck curve energy challenge will only become more widespread—but so will our ability to solve it with energy storage. The duck curve isn’t a flaw in solar energy; it’s a sign that we’re transitioning to a cleaner grid, and we just need the right tools to keep it stable. Batteries, especially advanced energy storage systems, are that tool: they address every pain point of the duck curve, from excess midday solar to steep evening ramps, while improving frequency response and reducing reliance on fossil fuels. California ISO reports now highlight battery storage as a key solution, and other regions are following suit. The duck curve may have started as a challenge, but it’s become an opportunity—to build a grid that’s cleaner, more reliable, and more resilient. And at the center of that opportunity is energy storage, turning the duck curve from a problem into a symbol of our transition to a sustainable energy future.
-

-

-
-
 2026-04-02
 -

How Can We Help?
Contact